Installation
Install with App Store
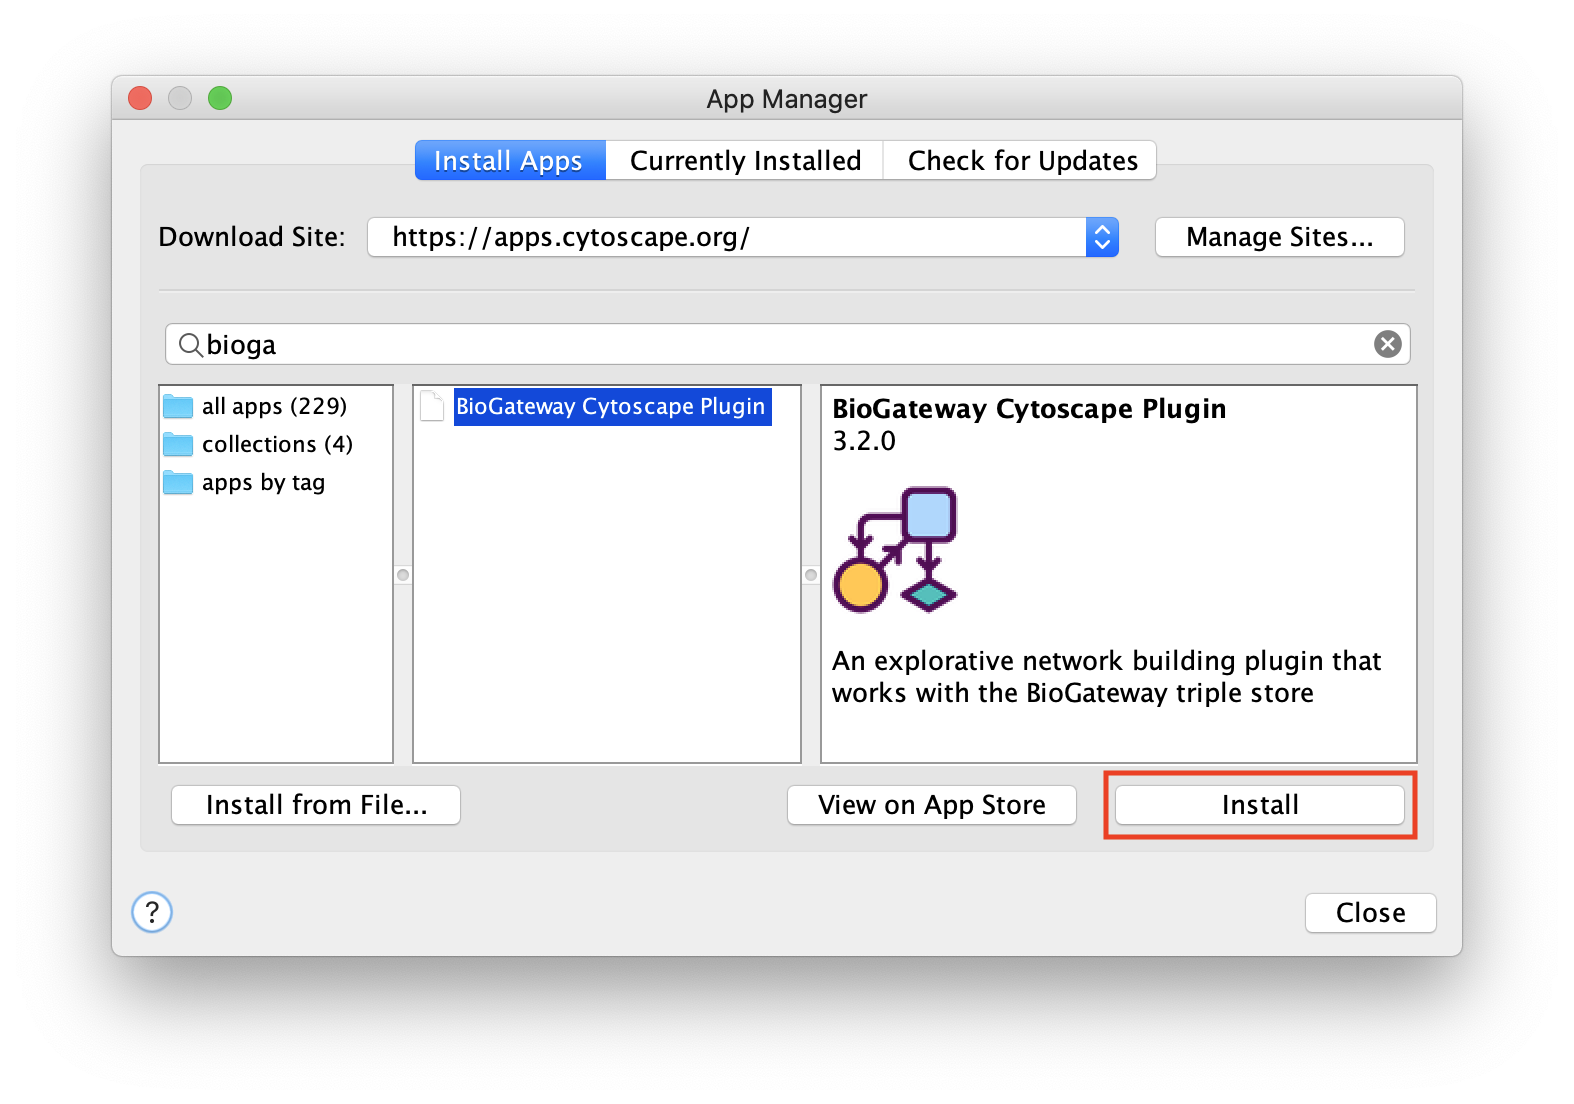
The BioGateway App is available in the Cytoscape App Store. This is the easiest way to install the app and stay up to date with the latest version.
Manual Installation
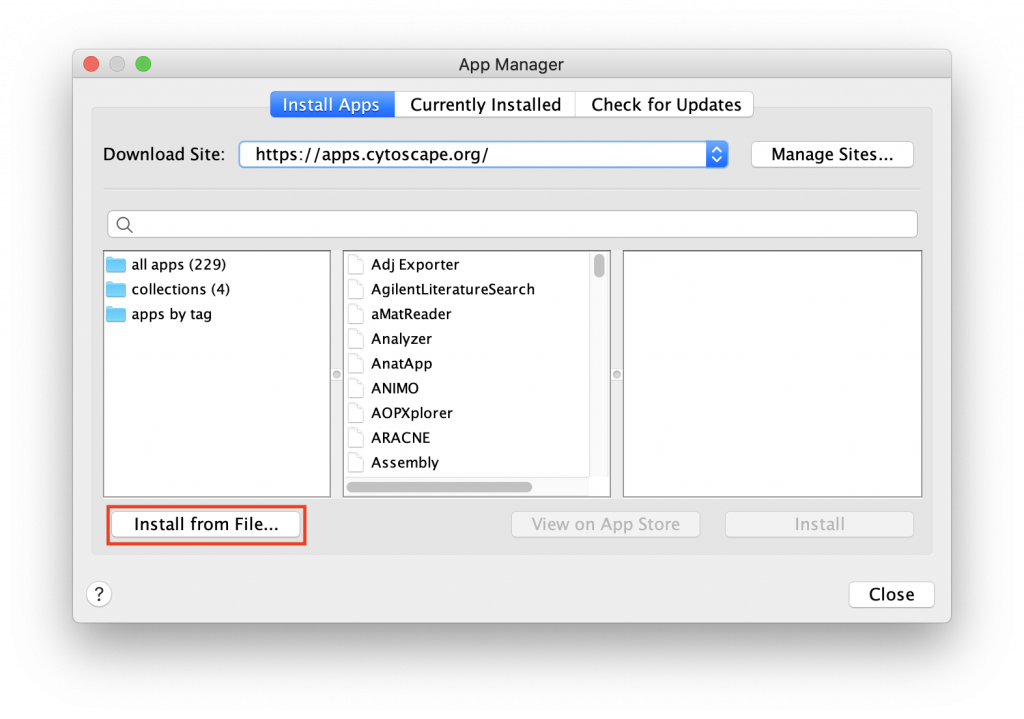
If installing through the Cytoscape App Store does not work, the app can be downloaded here and installed manually.
Querying Networks
Building Queries
BioGateway is an RDF Graph Database or ‘triple store’, and can be searched by building a query consisting of a set of questions that together specify what you are looking for. In this context, the “graph” is a network of nodes – shown as circles – and edges – the arrows connecting the nodes (see Example Graph Database, animation, to the right).
In the animation to the right, we see a representation of a mock network in a (very small) graph database of animals and some of their properties. The first question (part of a final query) selects for the animals that have the property of being “kept as” a “Pet”. This returns a subset of the network containing the nodes representing “Pet”, and the animals with edges of the type “Kept as” pointing to the “Pet” node.
By adding more question parts to the query, we can further specify the search. The second line in the query restricts the pets to those that are “Walking”, eliminating the Parrot from the results. And by further constraining the results to those pets that also are “Chasing” mice, we end up with a final query that results in the network shown in the last part of the animation.
Note that even though “Mouse” is not an animal satisfying all the conditions of the query, it is included because it is part of the relevant network for the query.
Example Graph Database
The BioGateway database is powered by Virtuoso, and queryable through SPARQL, a graph query language based on the same principle as above. We construct a query by step-wise specifying the nodes we want, and the relationships / type of edges between them.
Each new line represents an additional part of the query, consisting of a subject, predicate and object. Subjects and objects are always nodes, while predicates are edges. In BioGateway, these edges are also called relation types, because they represent a type of relation between two entities.
In BioGateway, the subjects and objects can either be bound to a specific value, like the node representing “Pet” or “Walking” in the animation above, or they can represent any value satisfying the conditions of the query. In the Cytoscape BioGateway App these unbound values are called “Sets”, as they represent the set of all values qualifying their part of the query.
The last query from the animation above could be formulated as a BioGateway query formulated as:
?animal kept_as Pet
?animal moves_by Walking
?animal chases Mouse
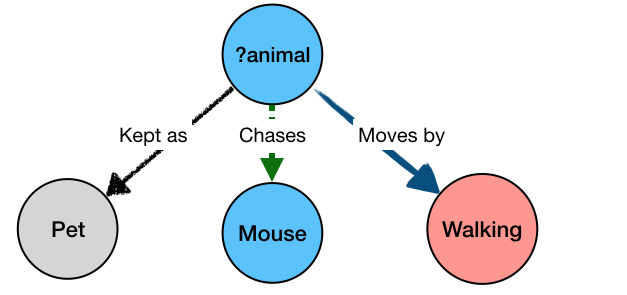
The “?animal” part is not bound to a specific value, but rather any value that can simultaneously satisfy all the parts of the query – i.e. be kept as a pet, and move by walking, and chase mice. The result of the query would be:
Cat   kept_as   Pet
Cat   moves_by  Walking
Cat   chases    Mouse
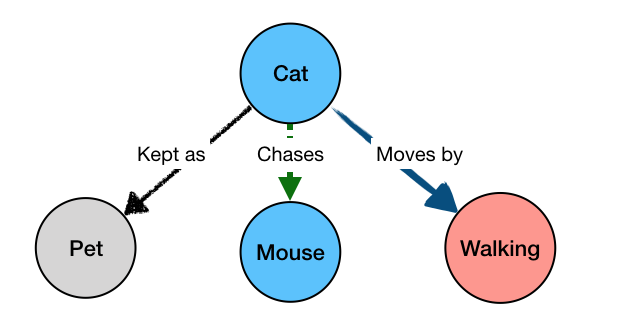
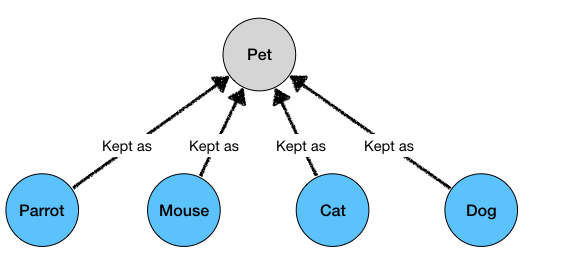
This is because “Cat” is the only value of “?animal” that would satisfy all the constraints of our query. For a simpler query, like the initial one from the animated example:
?animal kept_as Pet
We would get all the matching pets as results:
Cat kept_as Pet
Mouse kept_as Pet
Parrot kept_as Pet
Dog kept_as Pet
Example Tutorial
In the BioGateway App, we can use the Query Builder to build queries in a step-wise manner, using the same format as described above. A query consists of one or more lines, each specifying a selection of either a specific node or set of nodes, and their relation with another specific node/ set of nodes.
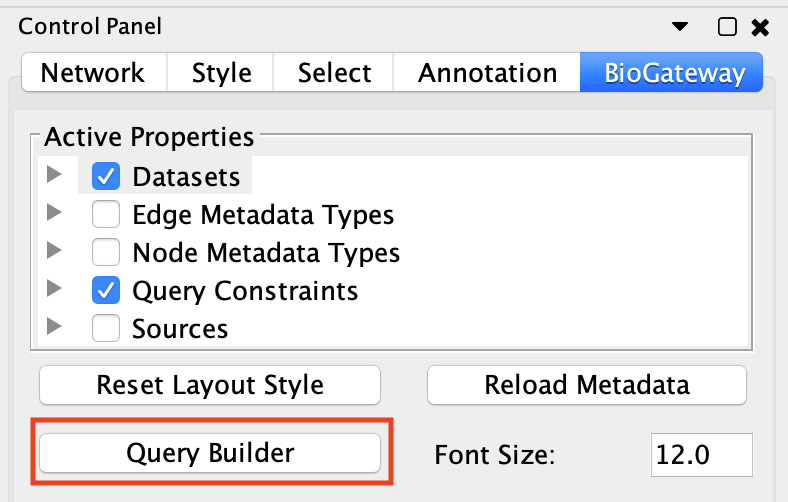
To see how this works, open the query builder, and load “Example 1a” (Figure 1).
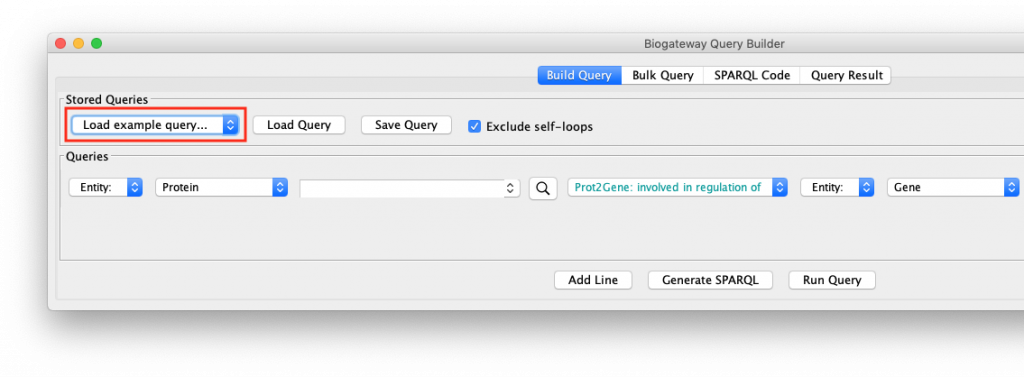
This will load a query consisting of two lines into the Query Builder. If you do not get these results, make sure that your internet connection is working, and that you have the latest version of the BioGateway App.
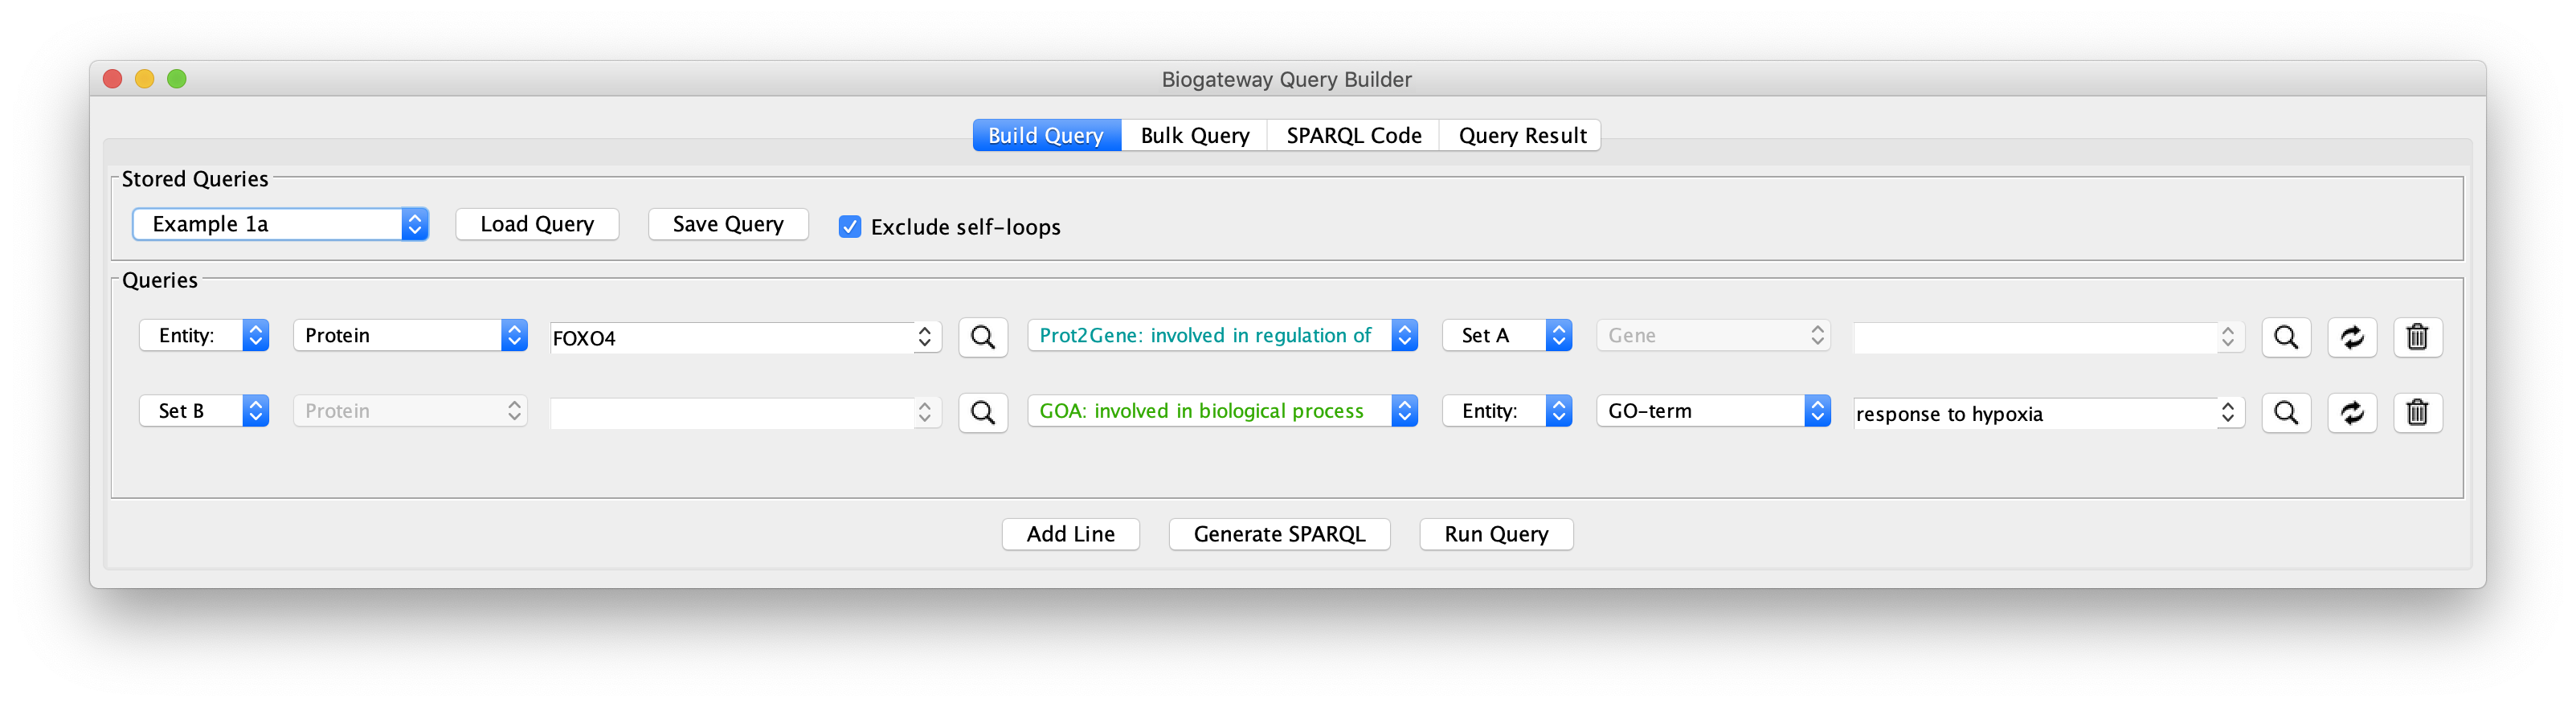
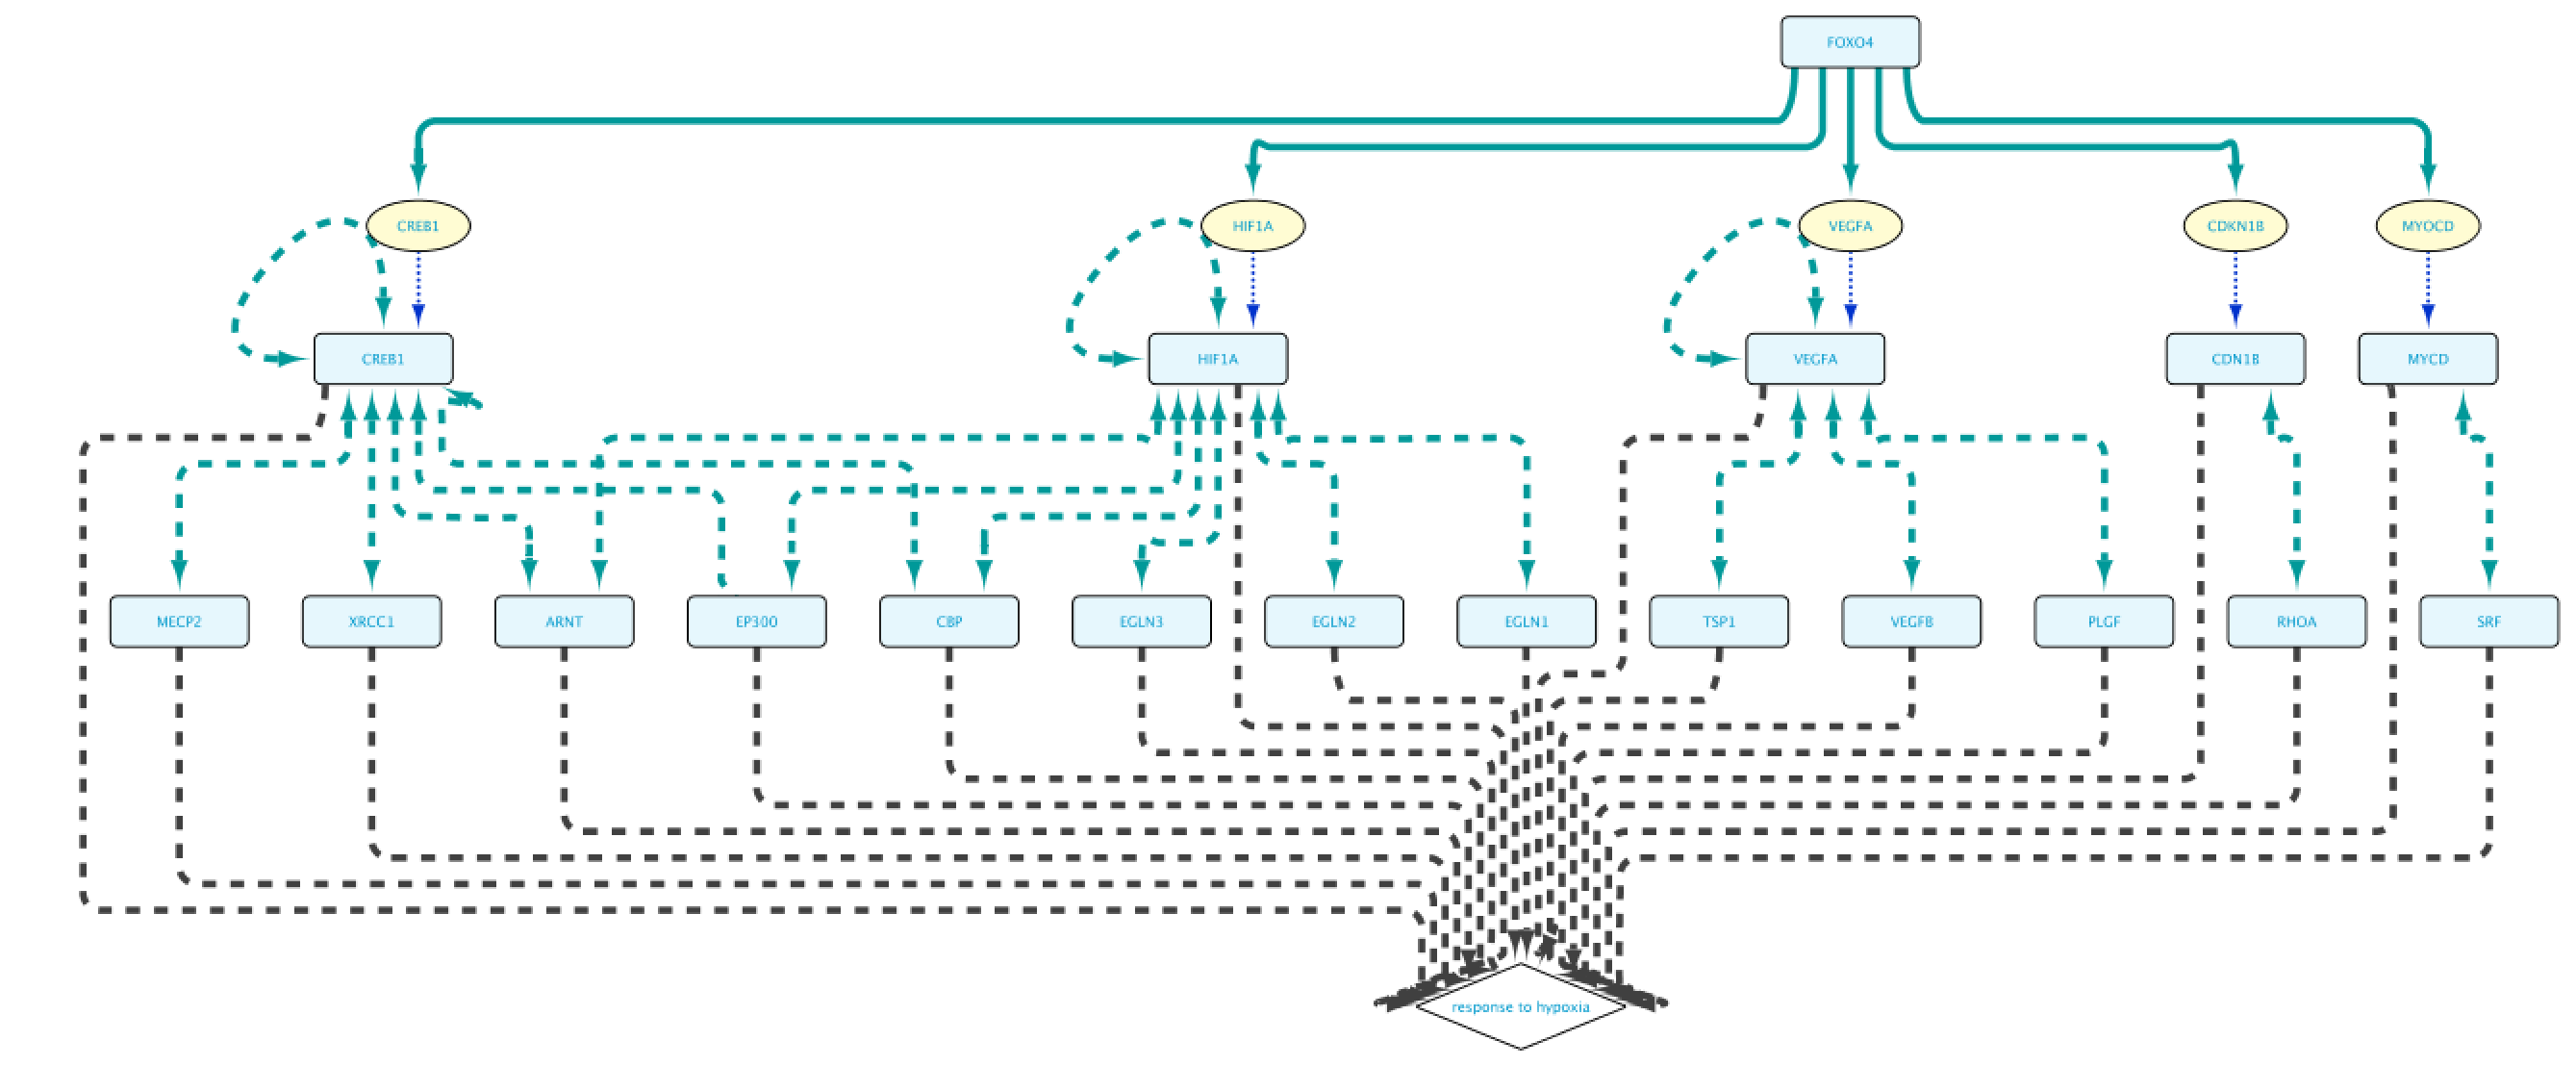
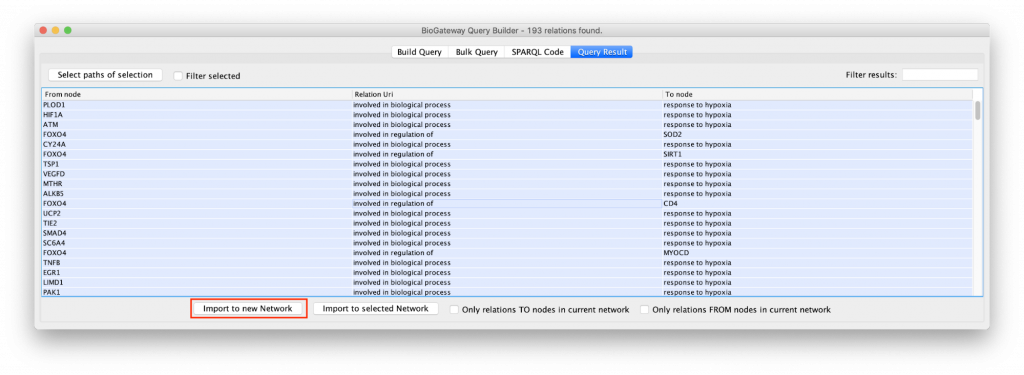
The “Example 1a” query (Figure 2) shows two lines that specify and return: (1) all the genes that are a transcriptional target of the transcription factor protein FOXO4; and (2) all the proteins that are annotated to be involved in the GO Biological Process “response to hypoxia”. Clicking on the Run Query button will launch the query against the BioGateway backend and open the Query Results tab. For all the examples in this section we will select all the results (click in results table and press CtrA) and import them to a new network by clicking on “Import to New Network”.
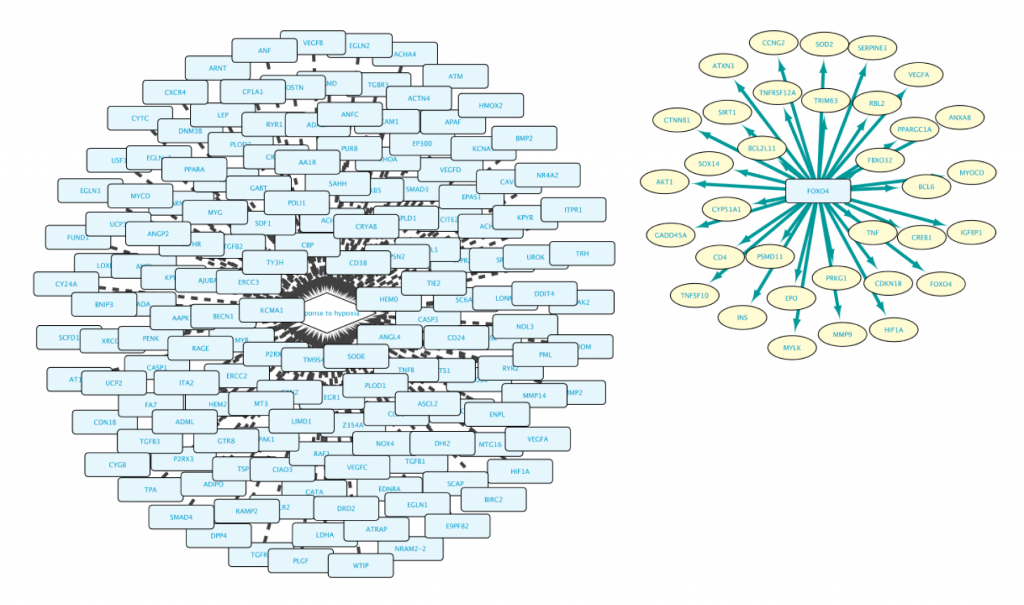
Note that the result of this query contains two separate clusters of nodes. There are two reasons for that:
- Lines 1 and 2 are asking for two independent and different sets (Set A in line 1, and Set B in line 2).
- Set A is composed of genes, while Set B is composed of proteins. It is important to bear in mind that Genes and Proteins are different entities in BioGateway.
Let’s include an extra specification in the query as shown in “Example 1b”. Clicking on that query shows a third specification:
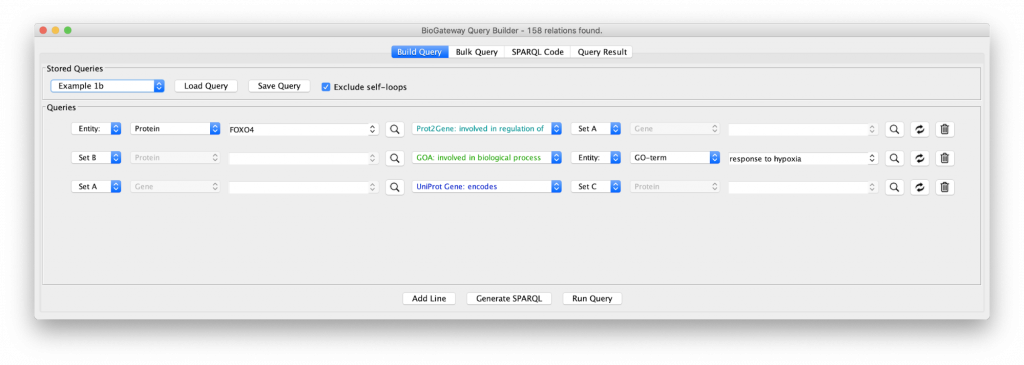
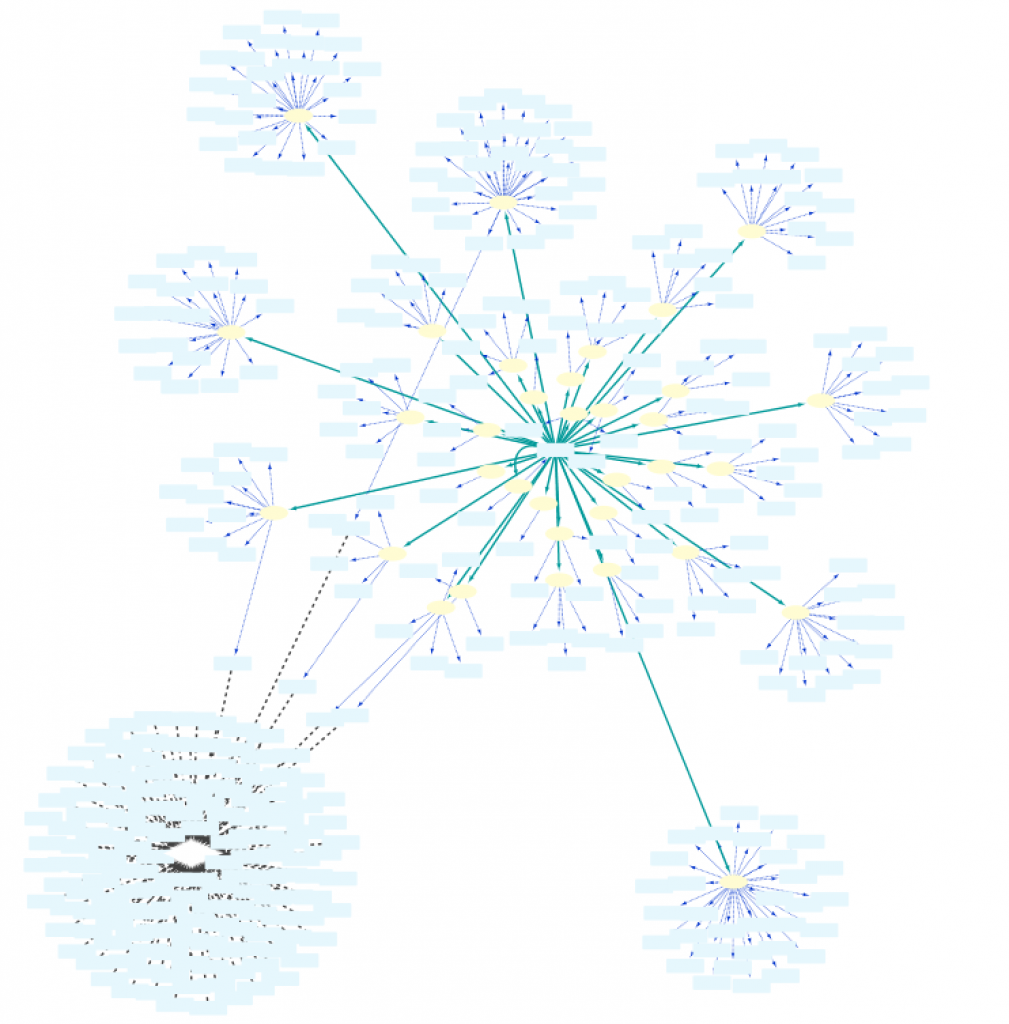
The new line asks for all the proteins (Set C) being encoded by the genes in Set A. The results of this query shows an even larger network with many of the genes now functioning as hubs connected to many proteins, because of the fact that a gene can code for many proteins. In addition, the network is now fully connected, because some of the genes code for proteins that are annotated with the GO term selected in query line 2.
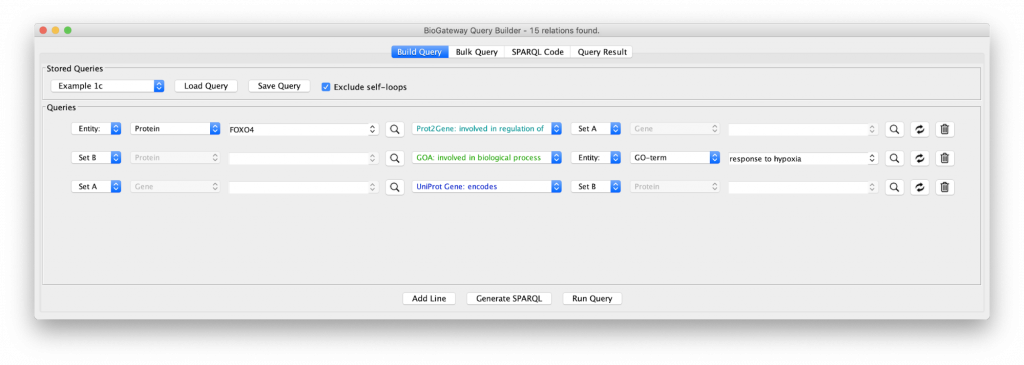
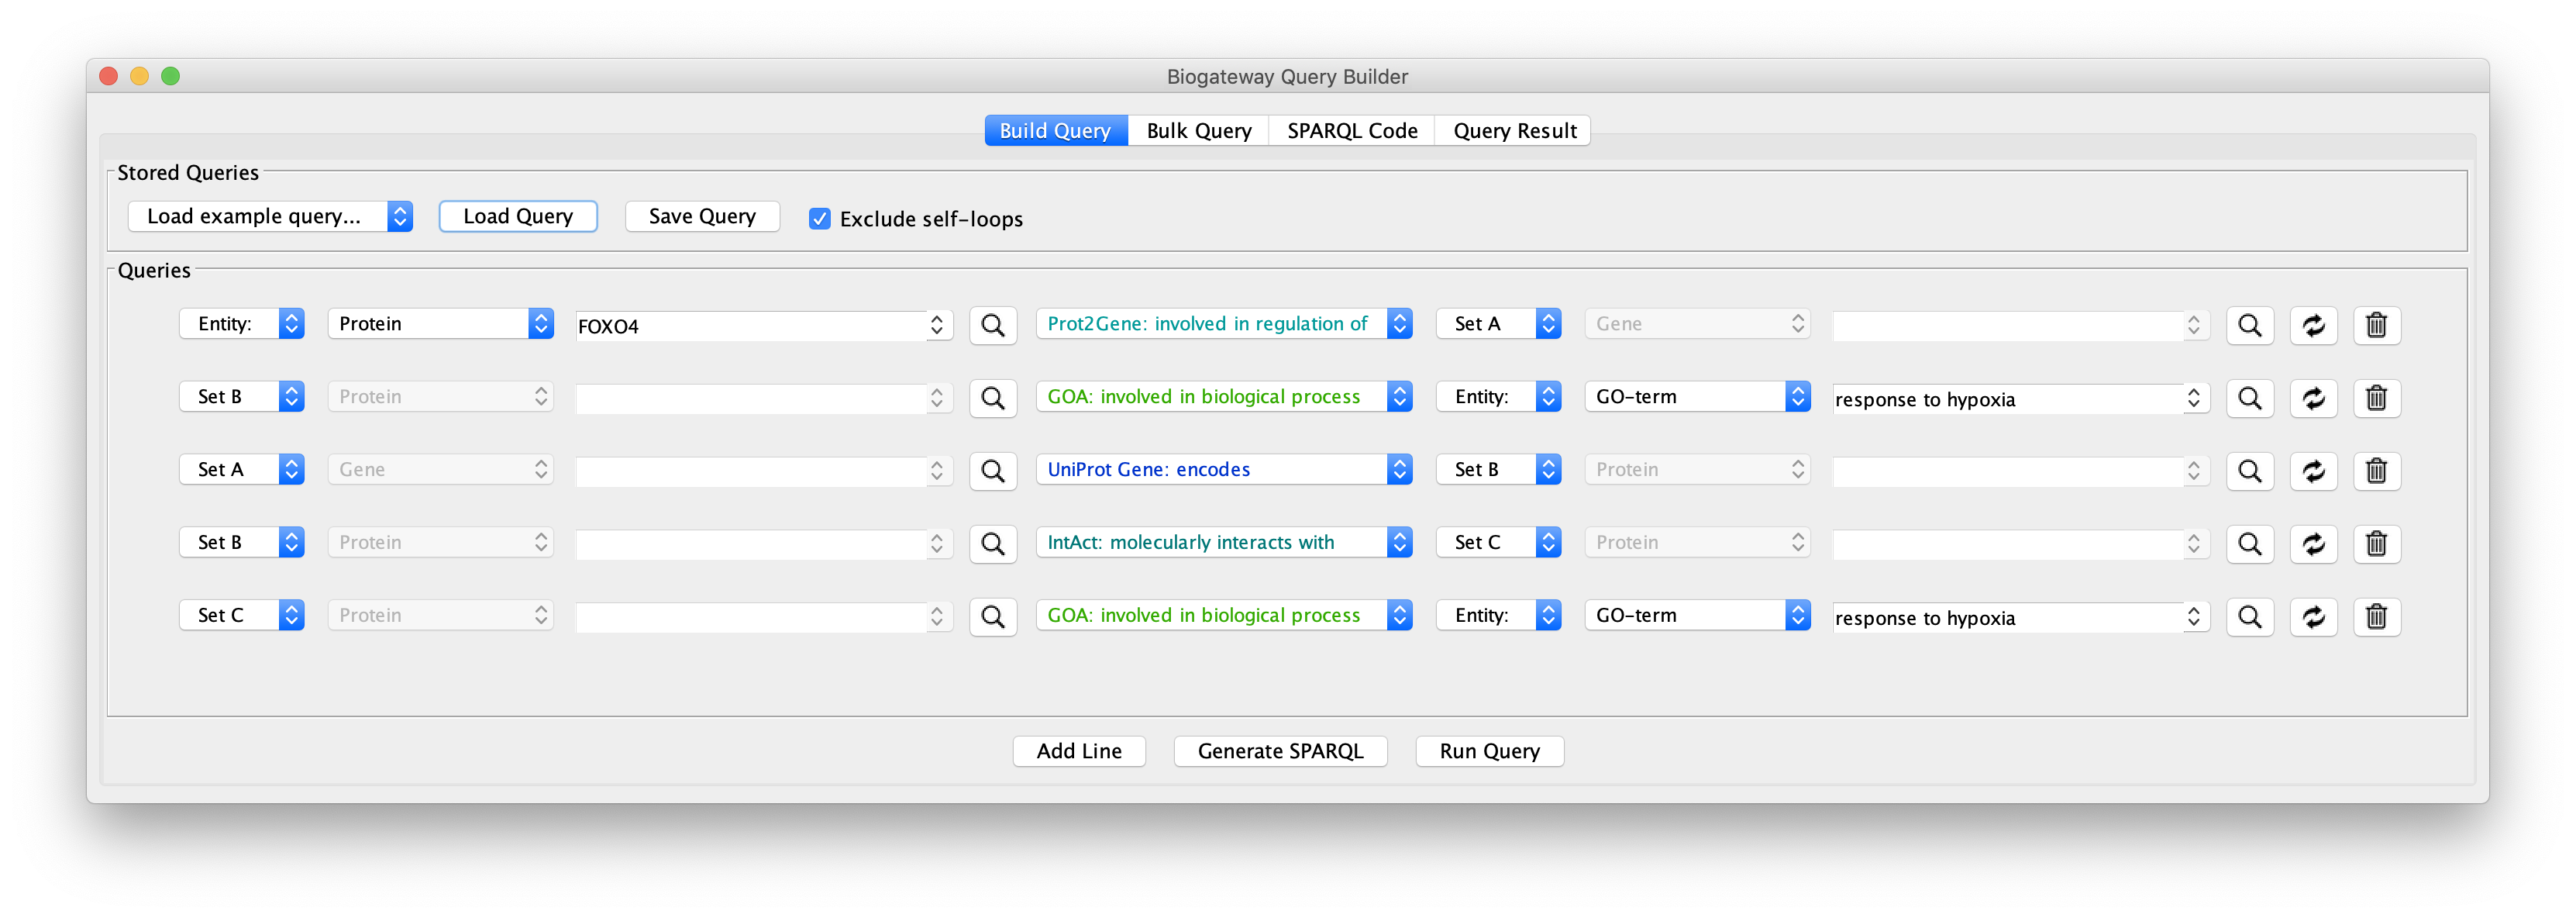
To obtain a smaller network, in “Example 1c” the Set C in line 3 is redefined to Set B. This small difference now restricts the proteins encoded by Set A to those that are involved in the Biological Process “response to hypoxia”:
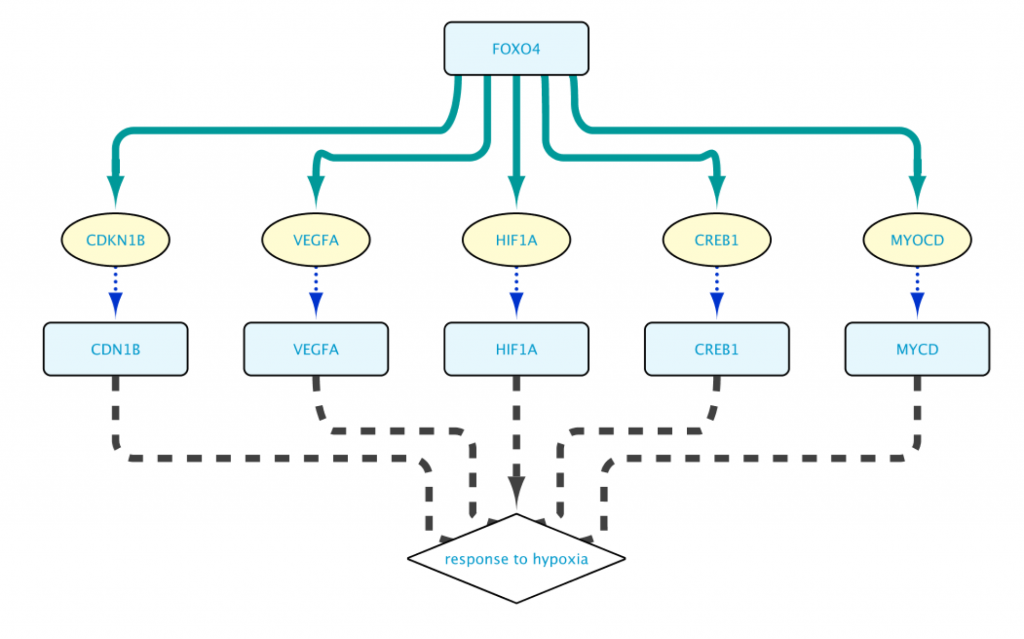
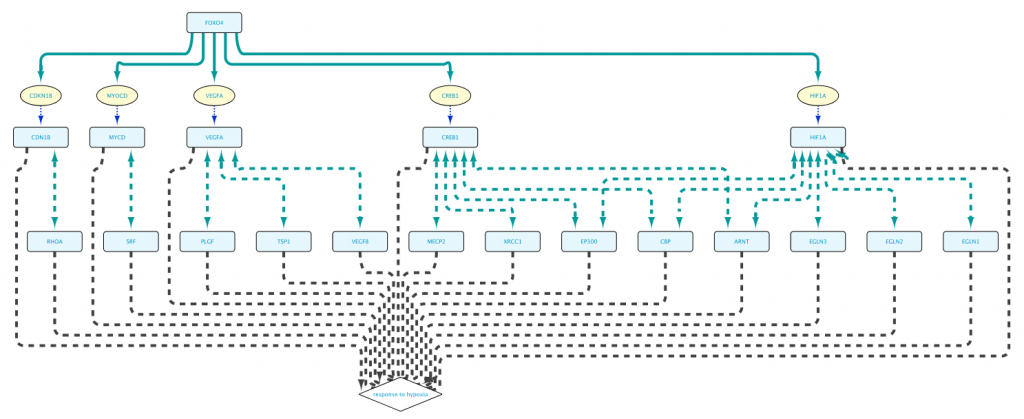
The resulting network shown in Figure 7 is now much more manageable, and to the point. (We used Cytoscape’s yFiles hierarchic layout algorithm for this figure.)
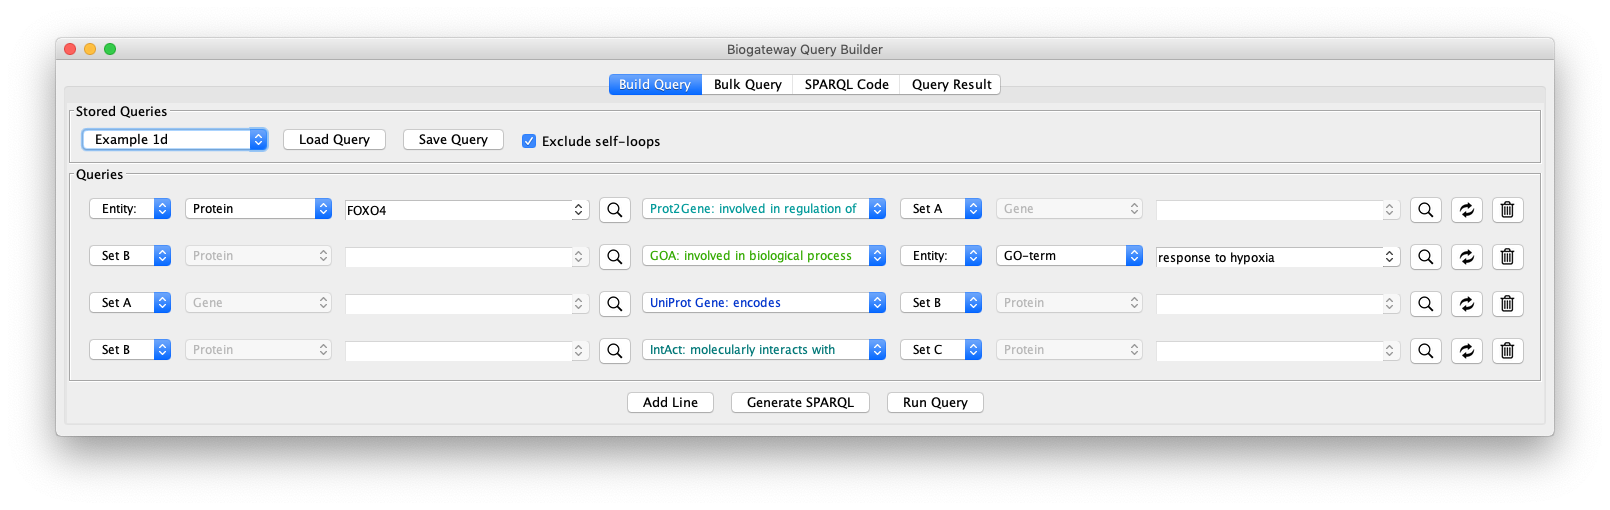
This network can be further extended by adding an additional query line, as shown in the “Example 1d” query. Line 4 specifies the following: return all the proteins (Set C) that interact with the proteins that are encoded by genes regulated by FOXO4 (Set B).
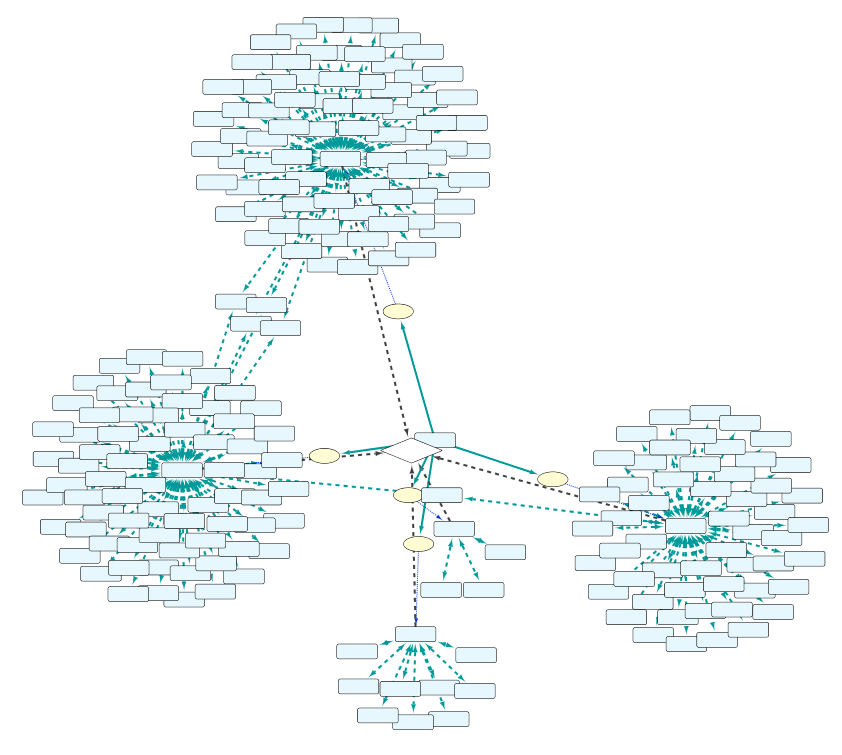
As can be seen in Fig. 9, by adding an extra selection to the query we have increased again the size of the network. One option to reduce the size again is shown in “Example 1e” (Fig. 10), where the interacting proteins in Set C are restricted to those involved in the Biological Process “response to hypoxia”.
The real value in the Query Builder is the ability to use it to formulate your own queries. An important help in this is the Autocomplete Search feature, which will help you to find the correct biological entities and relationships that you are interested in for your query.
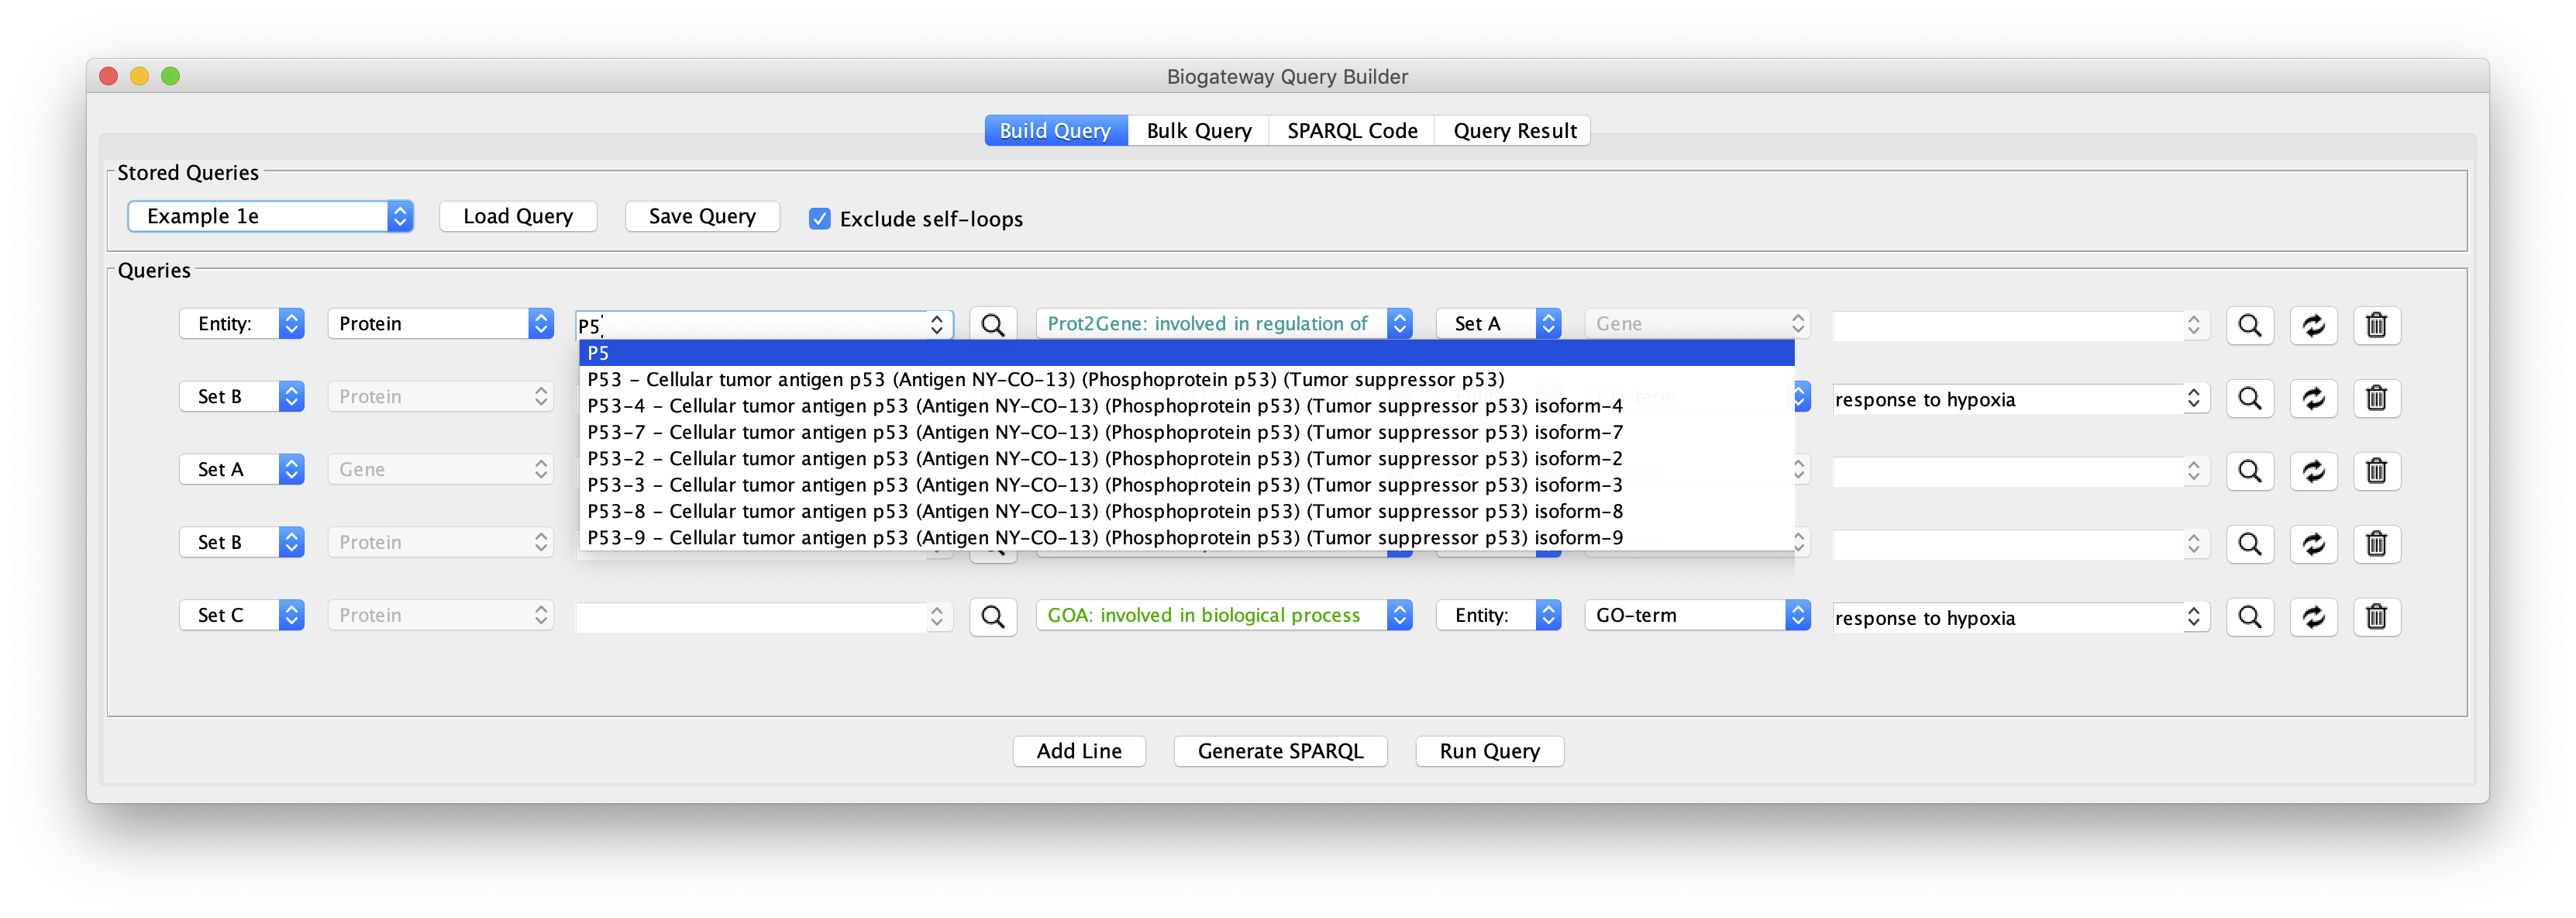
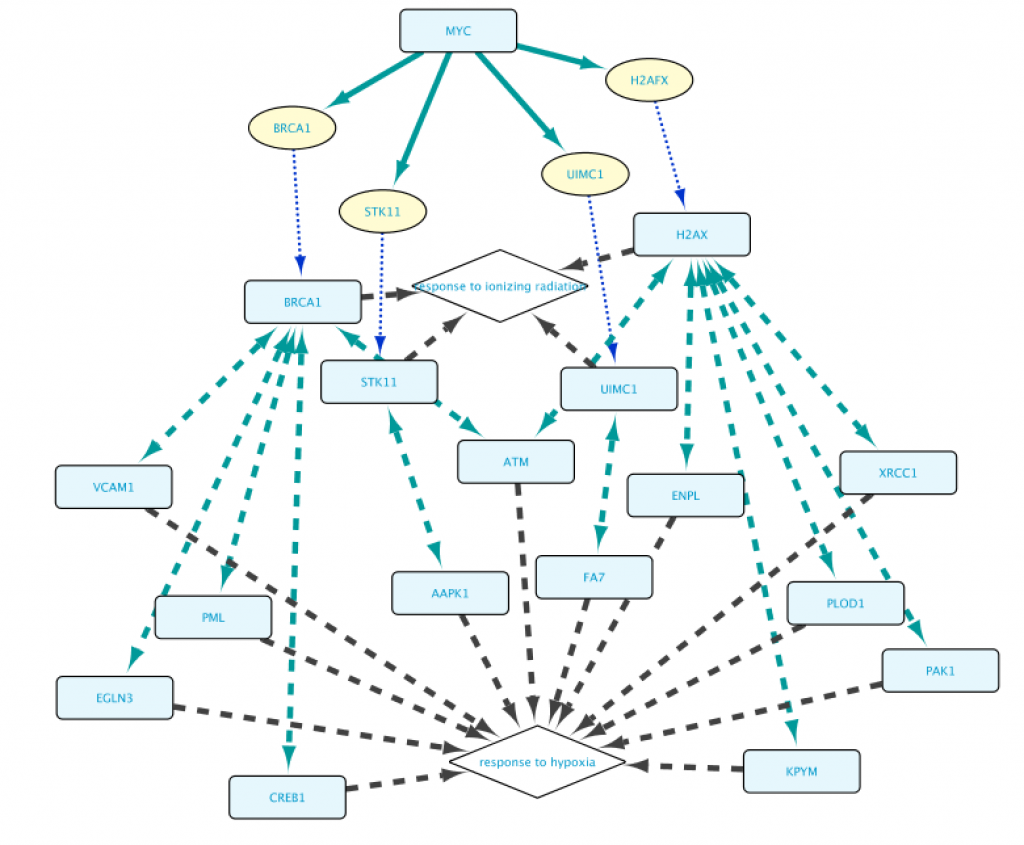
With the help of the autocomplete search function you can quickly and efficiently redefine any of the biological entities or the relationships from a query. Figure 13 shows the results after replacing FOXO4 with MYC in line 1, and the GO term “response to hypoxia” with ‘response to ionizing radiation” (line 2). This illustrates that all the examples from 1a to 1e can be used as templates for your own queries, and you will appreciate better the versatility of the App when tweaking these queries.
The next step is to learn how to create your own queries from scratch. For an introduction to that, please continue to the App Manual. More examples on how to use the BioGateway App to tackle Biological questions can also be found in the Use Cases page.
Allowing Self-loops in the network
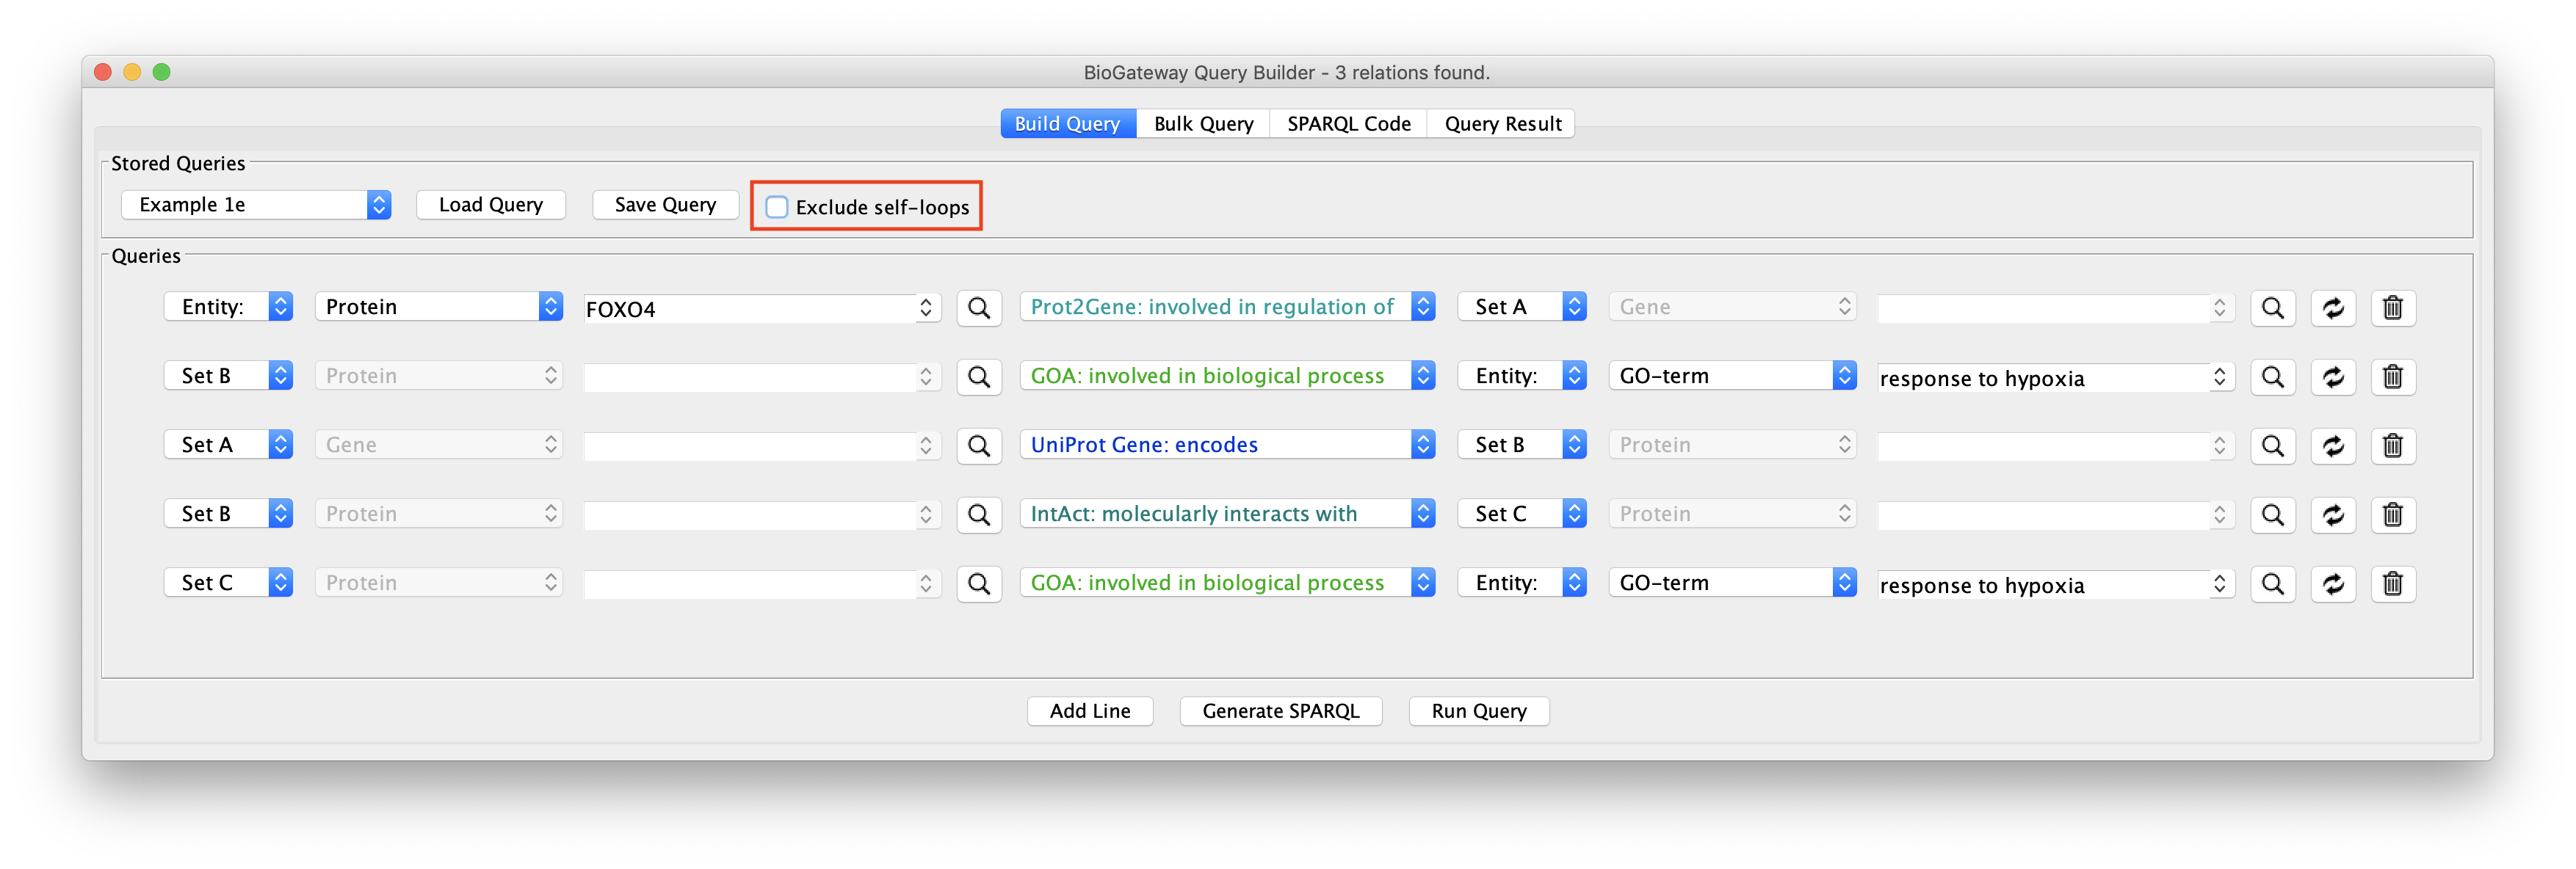
The Exclude self-loops option in the Query Builder is by default activated. Queries can be run with or without including self loops, meaning results that stem from entities having relationships with itself, for instance a protein having a homodimer relationship. Including self loops often results in (many) more results.
The effect of this option is illustrated in the figure to the right: load the Example 1e query in the Query Builder followed by unchecking the Exclude self-loops checkbox. This will now allow the network to contain self interactions of the nodes.
Next, run the query and importing all the results shows a network contains several self-loops of proteins.
A more detailed explanation of this Setting can be found in the App Manual.